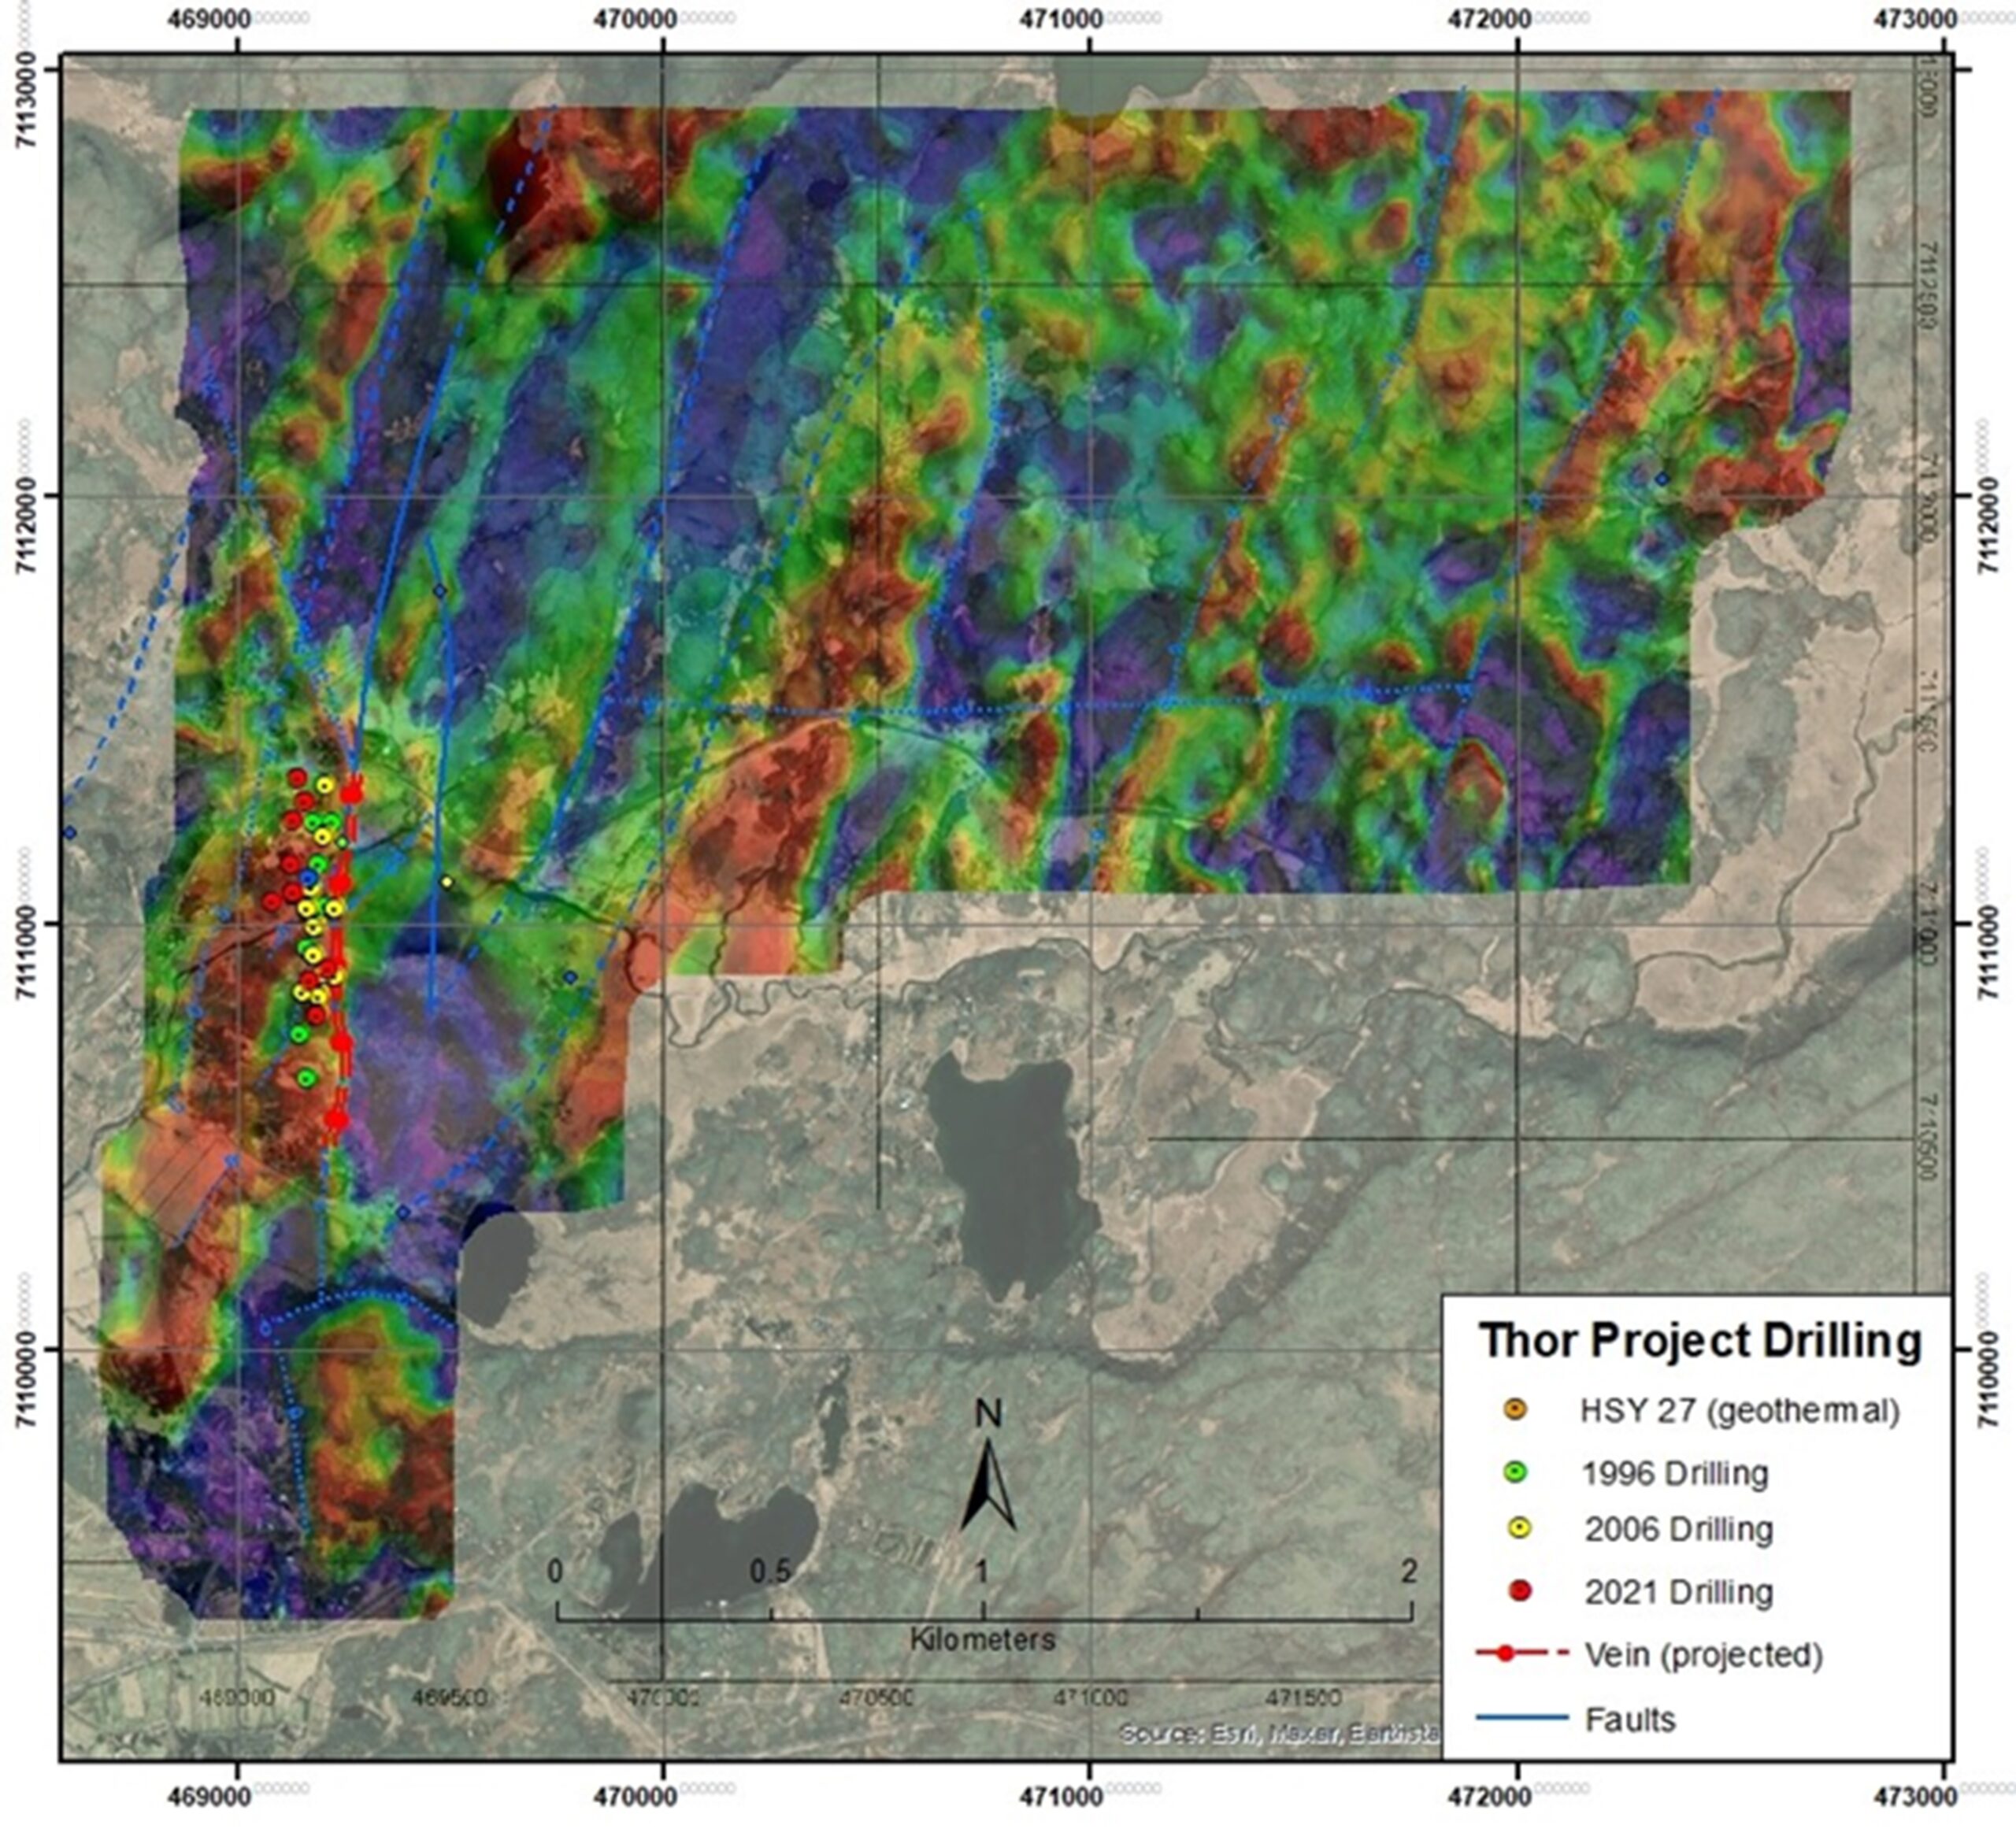
An additional upside to the project was defined, extending to depths of up to 130 meters and extending the zone to 800 meters along strike. All mineralization intersected is oxidized to date.
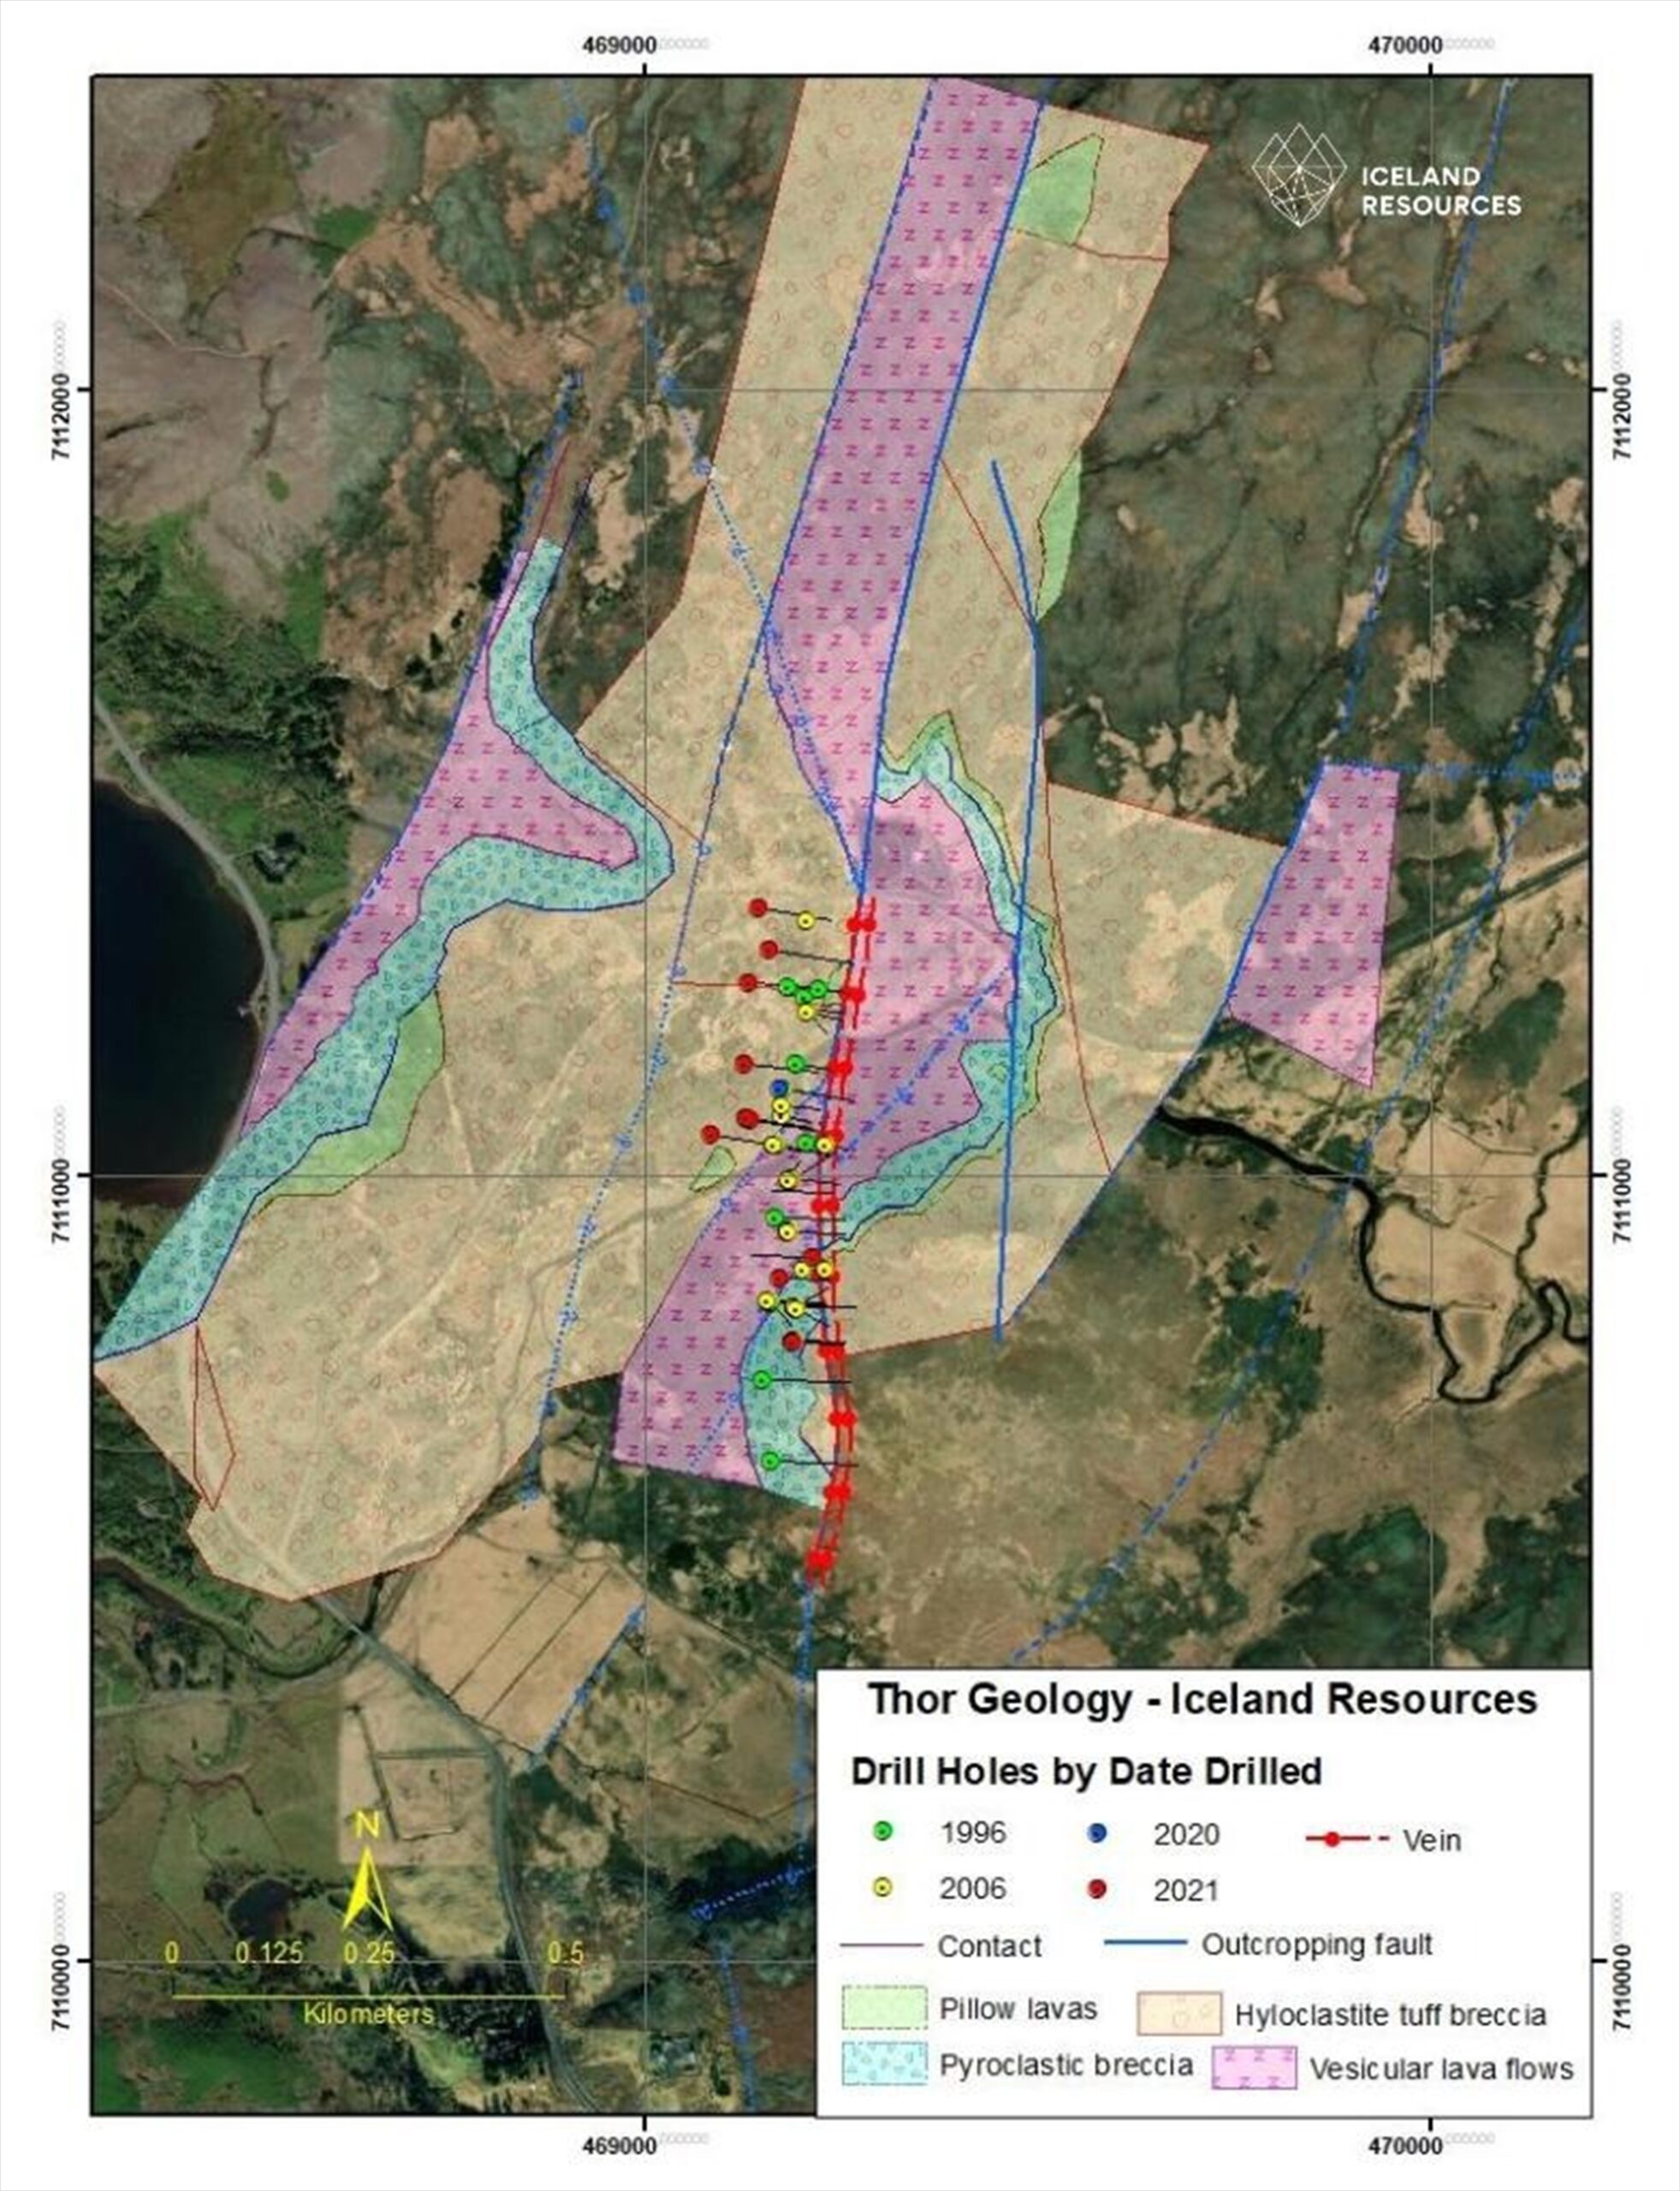
In the mid-1990s, a vertical geothermal hole was drilled to a depth of 455 meters. This hole encountered at least seven separate zones of mineralization. The 2021 drill program confirmed the existence of at least two and possibly three sub-parallel structures with significant gold grades to a depth of 100 meters.
Banded quartz veins identified in historic and recent drilling contain bonanza grades of gold from 44 to 415 grams per ton. The textures within the banding are similar to low sulfidation epithermal systems worldwide.
These textures contain rhythmic banding of quartz, adularia, and fine sulfides carrying values in both silver and gold.


Sample 2070 (TMSD 16-06 47.3 m)
Cockade breccia, with altered tuff clast (center) surrounded by concentric bands of very fine to fine quartz, adularia and calcite. Field of view = 3.0 mm, crossed polarizers.